
Powered by Technophiles Den
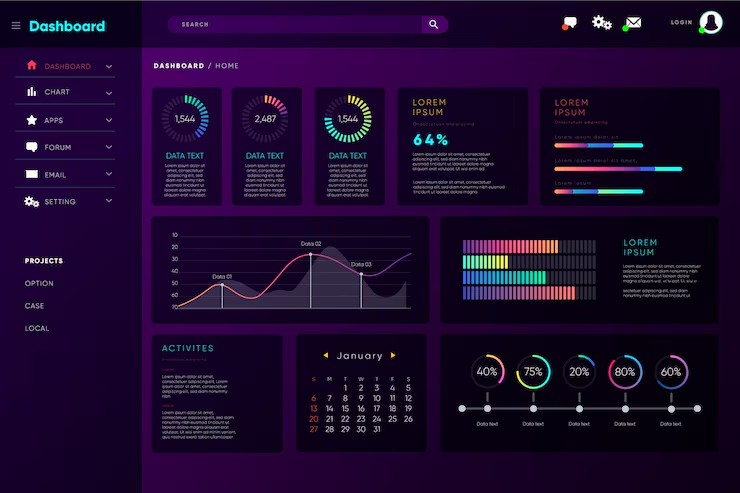
Eliminate tool sprawl with one single, easy-to-use observability platform.
Monitor your application performance, digital experience, business analytics, AIOps, and infrastructure monitoring with Dynatrace: an All-in-one, AI-powered, fully automated, enterprise-grade solution.
Monitoring Tools ensure high performance for your software. Constant monitoring of your system allows you to manage the performance and availability of software applications. This leads to quick response times, improved computing processes and satisfied customers. Especially digital end user experience is one of the main goals when dealing with real user interactions and business transactions. Dynatrace monitoring tools save the effort of interpreting such dependent events on your own and directs you to the component that might cause performance issues or problems for your customers. Fixing, accelerating, and optimizing your servers and software applications has never been so easy.
Traditional monitoring tools are often siloed and cannot deliver answers. When issues arise, teams are left searching for the proverbial needle in the haystack amongst their siloed data. This reduces productivity and negatively impacts user experience.
Dynatrace's observability platform leverages the power of automation and AI to ensure that even the most complex environments are fully monitored and instantly provides answers. Fixing, accelerating, and optimizing application environments in the modern cloud has never been so easy.
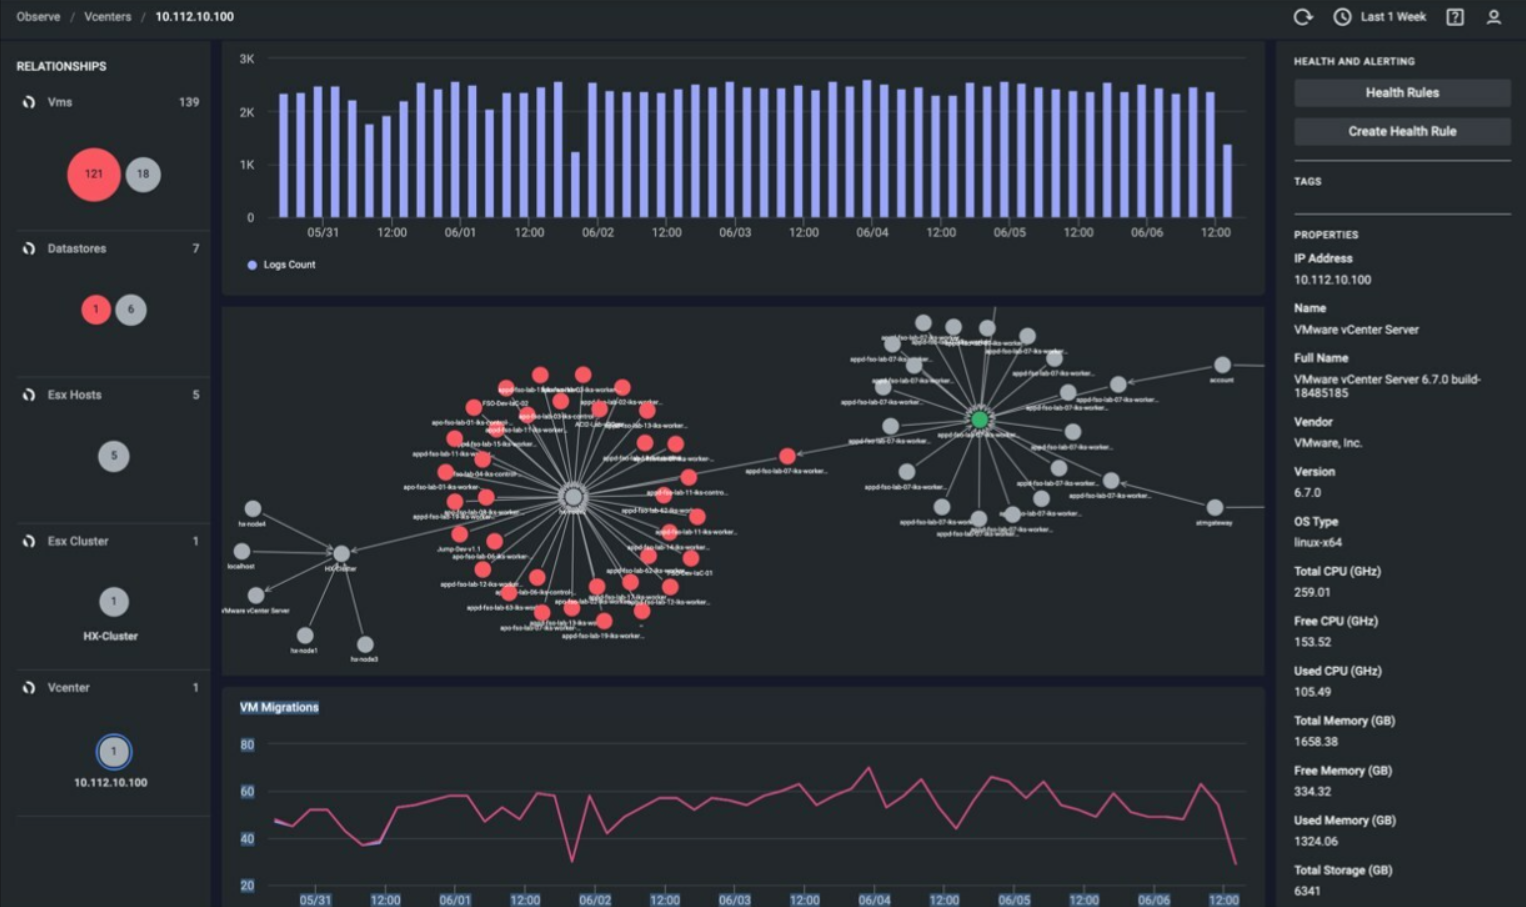
Get complete visibility across your cloud resources. Monitor workloads and troubleshoot app performance on cloud and virtualization platforms like Amazon Web Services, Azure, GCP, and VMware.
Learn MoreStay on top of outages and pinpoint server issues with root cause analysis capabilities. Create custom plugins and monitor critical attributes. Monitor Windows, Linux, FreeBSD, VMware, Nutanix, Docker, and Kubernetes.
Learn MoreIdentify application servers and app components that are generating errors. Monitor for Java, .NET, Ruby, PHP, Node.js, and mobile platforms.
Learn MoreMonitor the performance of internet services like HTTPS, DNS server, FTP server, SSL/TLS certificate, SMTP server, POP server, URLs, REST APIs, SOAP web service, and more from 130+ global locations (or via wireless carriers) and those within a private network.
Learn MoreGauge the application experience of real users. Analyze and segment performance by browser, platform, geography, ISP and more.
Learn MoreRecord and simulate multi-step user interactions in real browser and optimize login forms, shopping carts, and other applications.
Learn MoreComprehensively monitor critical network devices such as routers, switches, and firewalls. Get deep performance visibility required to manage complex networks.
Learn MoreCollect, consolidate, index, search, and troubleshoot issues using your application logs across servers and datacenter sites. With support for common applications and log frameworks: getting started is very easy.
Learn MoreHarness the power of artificial intelligence and machine learning to monitor your IT resources. Detect anomalies and orchestrate incident remediation with Site24x7's anomaly detection and IT Automation.
Learn MoreThe observability platform for DevOps & IT Ops — trusted by 13,000+ customers worldwide